Has SSMS (SQL Server Management Studio) been crashing on you? Have you been getting Out of Memory messages when attempting to run queries?
You may have noticed that this tends to occur after you’ve opened and closed 40 to 50 query windows. I’ve noticed this when I have had as little as 5 query windows open after having already opened and closed 30 or so other query windows.
Here’s what you end up seeing with the “System.OutOfMemoryException”:
After a simple search on Bing I found KB2874903, which states that SSMS is a 32 bit application and large queries can cause this message.
Taking a deeper look
In the world of current Windows operating systems there are 32 bit and 64 bit applications. If you’re a gamer you may recall all the memory problems Skyrim had on PC. They were all related to the executable being released as 32 bit. The 32 bit address space is limited to 2 GB on a 32 bit machine or up to 3 GB if the /3GB switch is used and the process is large address aware (LAA). On a 64 bit machine a 32 bit process is limited to 2 GB or 4 GB if the process is large address aware. A 64 bit process is limited to 8 TB. Quite a difference, right?
So why would a vendor release an application compiled as 32 bit? Simply put there are many more sales opportunities when you add 32 bit in the mix. So why limit your sales to just 64 bit users? The answer is you wouldn’t and they don’t.
What’s SSMS look like?
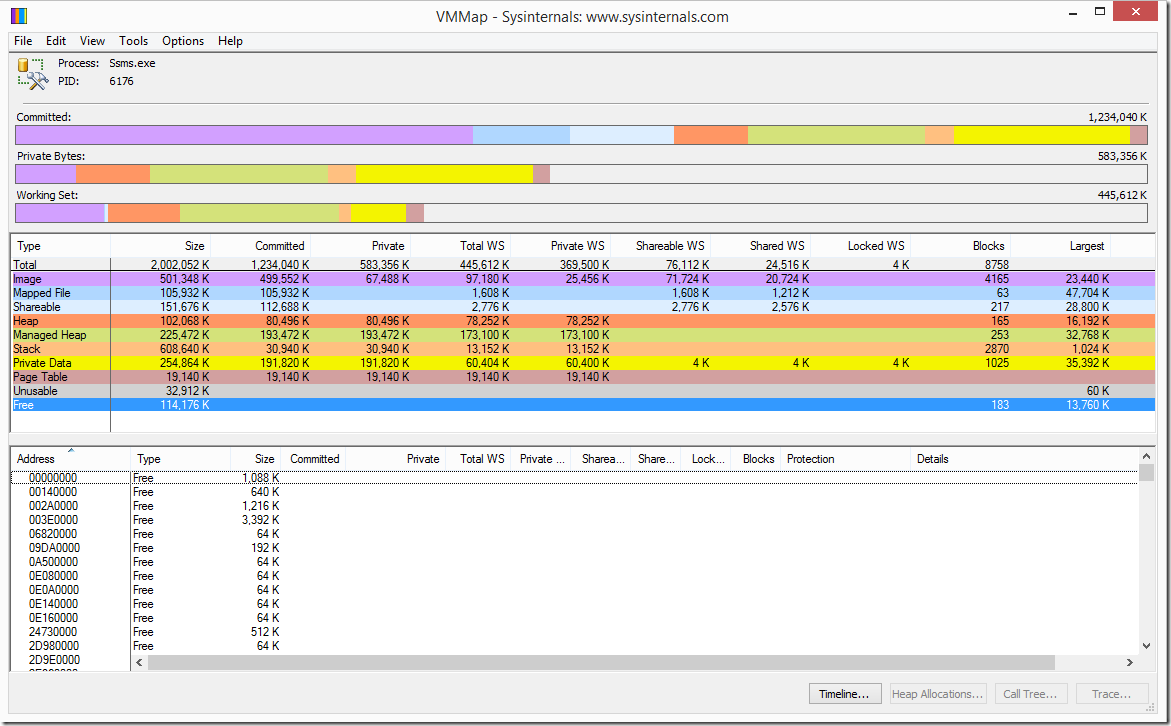
SSMS is a 32 bit process. This can be seen by attaching the process to VMMAP. Simply add everything up and you’ll see that the limit is 2GB of VAS (Virtual Address Space). Here’s one question though. Why isn’t SSMS compiled as LAA (Large Address Aware)? This would allow the process to consume the entire 4 GB 32bit address space on a 64 bit machine. While this wouldn’t resolve the issue it would give delay it by 100%.
So you’ve got plenty of memory but SSMS still gives OOM errors?
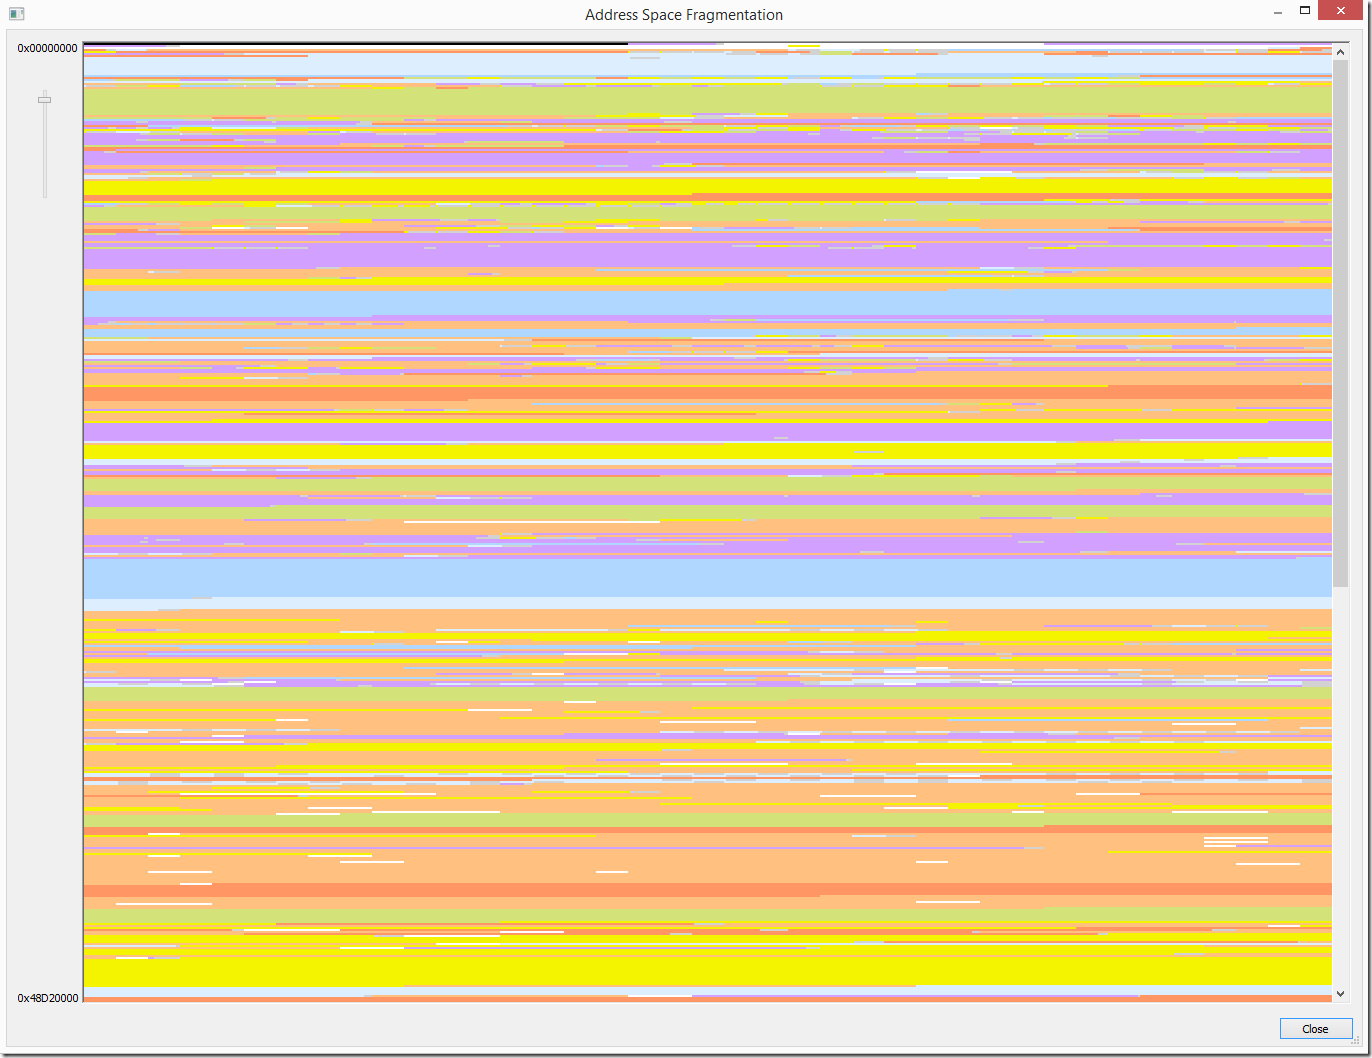
Yes that’s right. RAM doesn’t really have much to do with this message at all. This message is related to your virtual address space for the process. From the image above you can see that there is only 114 MB free of 2 GB. When a process allocates and deallocates bits in the VAS the area can become fragmented.
The little bits of white in this graph represent the free areas where new bits can go. Memory in Windows is allocated contiguously so if there isn’t a space large enough to fit your data it could result in an OOM error.
After opening and closing several query windows the free space declined and didn’t release.
You can see that the free memory has reduced to 67 MB.
Examining the process with Perfmon
When using PERFMON to examine a possible memory leak you want to monitor the following counters in the Process object:
- Handle Count – Shows the number of references to objects like files, windows, and registry keys
- Thread Count – Shows the number of threads created
- Private Bytes – Shows the total committed bytes for the process
- Working Set – Shows the total RAM for the process
The PERFMON graph above shows that when a query window is opened the handles, threads, and private bytes all grow.
When the windows are closed, SSMS does not release the associated resources. This certainly looks like a leak or at least has symptoms of one.
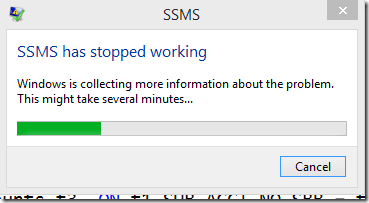
After a short while of these OOM messages SSMS decided to crash.
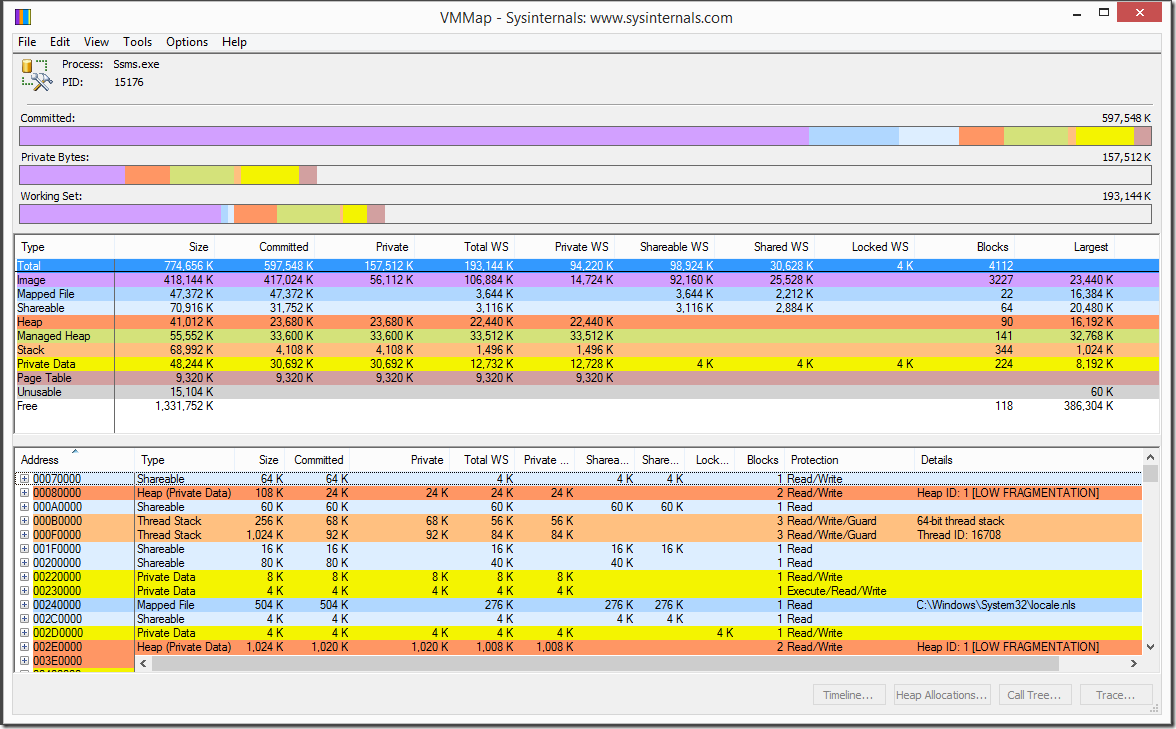
After the crash, SSMS restarted and you can see that all of the memory has been released.
And now the cycle begins again with the clock being restarted. After opening and closing enough query windows I’ll be back in the same Out of Memory boat.
Let’s hope that the team working on SSMS can look into this issue and resolve it quickly. I’m seeing quite a few people starting to complain about the apparent increase of these events since SSMS 2016 was released.
I’d be interested in hearing about any issues you’ve had with SSMS. Let me know.
*UPDATE 2016-10-07* – Microsoft reached out to me on Twitter saying that this has been fixed in the latest update for SSMS. I have tested SSMS release 16.4.1 (build 13.0.15900.1) and can confirm that the Virtual Bytes and Private Bytes appear to be cleaning up appropriately. Be sure to get the latest build from https://msdn.microsoft.com/library/mt238290.aspx to avoid any memory related crashes that may cause you to lose your work.
*UPDATE 2016-10-14* – I was working on a small query this morning and the issue happened. The query only returned a couple rows. I ended up closing a few windows and was able to run the query. I then ran a slightly larger result for the same query and found that after scrolling down I could no longer scroll up. I checked my Virtual Bytes and sure enough I had nearly 1.85 GB used. Following this SSMS crashed and everything was back to normal. @Microsoft, release 16.4.1 did not resolve all memory leaks in SSMS.
*UPDATE 2016-11-22* – I’ve been using build 13.0.15900.1 for a few weeks now and I can say that it is much better. I’ve only had one Out of Memory (OOM) message in the past month. I’ll be upgrading to the latest today and will keep an eye on it. One of my co-workers has been getting a lot of OOM messages from SSMS and he’s on version 13.0.16000.28 (16.5).


Since you asked for “any issues”, here’s mine: SSMS won’t even launch. Just downloaded and installed, and all I get is a beep as repayment when I try and launch it. So far my googling hasn’t helped.
LikeLiked by 1 person
Sorry to hear you’re having problems with SSMS. Have you tried asking for help on Twitter at @SQLHELP? The TechNet forums are also helpful from time to time. You may also want to look at the “setup bootstrap” folder log files to see if there are any errors. Here’s some info on the setup log files: https://msdn.microsoft.com/en-us/library/ms143702.aspx
LikeLike
This has been very frustrating and while the frequency has decreased, it’s still very gut wrenching when it happens. Is a 64 bit anywhere on the roadmap? I’ve been using dbForge as a scratch pad to avoid this only only using SSMS when I need to. But, I’d prefer to just stay in SSMS.
LikeLike
I would hope so. I suggested just compiling the exe as Large Address Aware to double the size of virtual address space for the application though I don’t believe that’s something they are considering. Hopefully a fix will be around quickly. If you get these frequently, capturing the process with procdump from sysinternals could be really helpful for the product group.
LikeLike
I’m using SSMS version 13.0.16100.1 and still frequently get the OutOfMemory error. Very frustrating. When I get the error, I can close every query tab, the object explorer details tab and close every connection in Object Explorer, then open one query tab and run “select 1” and it’ll still get the error. Restarting SSMS is the only solution. I’ve had this problem using SSMS for SQL 2012 through to this SQL 2016 version.
LikeLike
Still happens to me frequently on the latest version. Very productivity inhibitive to keep having to close and reopen as soon as queries stop running and throwing this error. Also the frequent crashes doesn’t help. At least the older versions didn’t crash. Puleeeeeease make a 64 bit version Microsoft! 🙂
LikeLiked by 1 person
I’m so fed up with this. It happens to me multiple times a day. I have 13.0.16000.28
LikeLiked by 1 person
This is my single largest productivity inhibitor… I keep trying the latest version of SSMS each time praying that this issue will finally be resolved. NOPE v17.1 and still the same old bool sheet.
LikeLike
Great write up. Love all the detail and work you did for this. Also like the updates you added as late as Nov. 2016…only problem is MS HASN’T fixed this issue in any way. I continue to get OOM errors and don’t have anywhere near as many windows open as you are talking about. I’ve just upgraded to 17.3, which MS told me would have better memory management…it doesn’t. I had been running on 17.3 for around an hour, had about 6 connections open. System froze on me while I was typing a table name. Had to use task manager to kill it. Restarted it, recovered the windows I had open, ran a couple of queries and got OOM. Nothing special even in the queries, couple of hundred rows at most with a max of 50 columns or so on 1 query.
LikeLike
if you are still seeing OOM exceptions with 17.3, it’d be cool if you could use procdump to catch some full dumps at the time of the exceptions. I’d be happy to debug them. Full dumps may contain private data so you may want to repro with non-production data if possible, though I am bound to not share any data I get. File a Connect item for the issue for sure and we can work through that to get the DMP from you. thx
LikeLike
Thanks for the offer. What are you looking for exactly? ProcDump has more than a few options, any items in particular that you do want used or not?
Also, I was speaking with the folks at RedGate and they suggested a program called: “Large Address Aware”. I loaded it up and it seems to have slowed my OOM messages down, only been using it for a day now so can’t say for sure if it is a “fix” or not. But I don’t to have to use it for a long term solution.
LikeLiked by 1 person
Ssms 17.3 and newer are marked large address aware. You can use procdump to monitor ssms.exe specifically for System.OutOfMemoryException, and use /ma to generate a full dump.
LikeLike
It’s great that SMS 17.3 is “marked large address aware” what would it take to get it to actually use the extra memory??
LikeLike
a very large query result set
LikeLike
i usually use something like “procdump -e 1 -f OutOfMemory -ma -w ssms.exe”
LikeLike
SSMS 17.3 is compiled as largeaddressaware
LikeLiked by 1 person
Sorry for the lagging response, but was waiting for the message to happen again. Since I loaded the “Large Address Aware” program, I haven’t had the message on my computer. I will reboot today and run without LAA to see what happens. In the meantime, one of my co-workers got the OOM error yesterday. He had 2 tabs open and was running a very simple select * against a relatively small table. We fired up procdump and got this: Doesn’t seem like much, maybe we didn’t let it run long enough?
Waiting for process named ssms.exe…
Process: Ssms.exe (30336)
Process image: C:\Program Files (x86)\Microsoft SQL Server\140\Tools\Binn\ManagementStudio\Ssms.exe
CPU threshold: n/a
Performance counter: n/a
Commit threshold: n/a
Threshold seconds: n/a
Hung window check: Disabled
Log debug strings: Disabled
Exception monitor: First Chance+Unhandled
Exception filter: [Includes]
*OutOfMemory*
[Excludes]
Terminate monitor: Disabled
Cloning type: Disabled
Concurrent limit: n/a
Avoid outage: n/a
Number of dumps: 1
Dump folder: C:\
Dump filename/mask: PROCESSNAME_YYMMDD_HHMMSS
Queue to WER: Disabled
Kill after dump: Disabled
Press Ctrl-C to end monitoring without terminating the process.
[14:47:47] Exception: E0434352.CLR
[14:47:47] Exception: E0434352.CLR
[14:47:47] Exception: E0434352.CLR
[14:47:47] Exception: E0434352.CLR
[14:47:47] Exception: E0434352.CLR
[14:47:47] Exception: E0434352.CLR
[14:47:47] Exception: E0434352.CLR
[14:47:47] Exception: E0434352.CLR
[14:47:47] Exception: E0434352.CLR
[14:47:47] Exception: E0434352.CLR
[14:47:47] Exception: E0434352.CLR
[14:47:47] Exception: E0434352.CLR
[14:47:47] Exception: E0434352.CLR
[14:47:47] Exception: E0434352.CLR
[14:47:47] Exception: E0434352.CLR
[14:47:47] Exception: E0434352.CLR
[14:47:47] Exception: E0434352.CLR
[14:47:47] Exception: E0434352.CLR
[14:47:47] Exception: E0434352.CLR
[14:47:47] Exception: E0434352.CLR
[14:47:47] Exception: E0434352.CLR
[14:47:47] Exception: E0434352.CLR
[14:47:47] Exception: E0434352.CLR
[14:47:47] Exception: E0434352.CLR
[14:47:47] Exception: E0434352.CLR
[14:47:47] Exception: E0434352.CLR
[14:47:47] Exception: E0434352.CLR
[14:47:47] Exception: E0434352.CLR
[14:47:47] Exception: E0434352.CLR
[14:47:47] Exception: E0434352.CLR
[14:47:47] Exception: E0434352.CLR
[14:47:47] Exception: E0434352.CLR
[14:47:47] Exception: E0434352.CLR
[14:47:47] Exception: E0434352.CLR
[14:47:47] Exception: E0434352.CLR
[14:47:47] Exception: E0434352.CLR
[14:47:47] Exception: E0434352.CLR
[14:47:48] Exception: E0434352.CLR
[14:47:49] Exception: E06D7363.msc
[14:47:49] Exception: E0434352.CLR
[14:47:57] Exception: E0434352.CLR
[14:47:57] Exception: E0434352.CLR
[14:47:57] Exception: E0434352.CLR
[14:47:57] Exception: E0434352.CLR
[14:47:57] Exception: E0434352.CLR
^C
[14:49:02] Dump count not reached.
LikeLike
An update: I’ve upgraded to SSMS v17.3 (14.0.17199.0) and haven’t experienced an out of memory error since.
That said… The update seems to be more of a mask for the memory leak problem. I used to get the out of memory errors when SSMS reached around 650GB of RAM in use. Right now, my SSMS is using 1.1GB of RAM. I can close all query windows and connections in Object Explorer and it’ll still use over 1GB of RAM. Bottom line: Thanks for resolving the out of memory errors, but it would be great to also fix the memory consumption issue.
LikeLike
Verified the same behavior in SSMS v17.8 (14.0.17276.0)… No more out of memory errors, but if I use SSMS for a couple days then close *all* windows (no query windows open, no object explorer, etc), it releases no memory – right now it’s sitting at 1.66GB according to task manager.
LikeLike
The issue is still happening in SSMS v17.9 but the RedGate tools (SQL Prompt) may be the culprit.
Also, I’m using SSMS v17.9 on a remote server and, each time I remote in, SSMS freezes for anywhere from between 30 seconds to 2 minutes and often crashes and restarts. It’s such a pain!
LikeLike